Duration of prodrome and of disease
Late last year, I blogged about a new pre-print from the London study of pre-symptomatic people at risk for genetic prion disease. That study was just officially published [Mok 2023]. The editors asked Sonia to write a brief commentary on it, which became an opportunity for us to share a realization that this study helped crystallize: across genetic neurodegenerative diseases, the duration of prodromal neuronal damage appears to be correlated with the duration of disease [Minikel & Vallabh 2023] (full text).
If you search for prodrome, you’ll find that some dictionaries define it as “an early symptom indicating onset.” That’s actually not how it’s commonly used in the study of neurodegeneration these days. Many people use the word prodrome, and I’ll use it here, to mean a period when the disease process is progressing at the molecular or cellular level, before any symptoms at all. It’s been just over a decade since the seminal discovery that the brains of people at risk for early onset Alzheimer’s are already changing in all sorts of ways as much as 25 years before onset [Bateman 2012], and many other diseases have followed suit (details reviewed further below).
The realization is that across diseases, how long (on average) neurons are dying or being damaged before onset, may be correlated with how long (on average) people survive after onset.
If that seems obvious, good. I’m on your side. When Sonia and I were first putting together our strategy for primary prevention in at-risk people back in 2017, we talked to a lot of neurologists for advice. A lot of people expressed skepticism about our desire to base trial eligibility on a genetic test report, and trial outcomes on a pharmacodynamic biomarker. They pointed to evidence from Alzheimer’s and Huntington’s, where neuronal damage appears to be going on for decades before disease onset, and advised us to find the same thing in prion disease, enroll people in trials who showed evidence of neuronal damage, and then treat them and see if the neuronal damage went down. We objected that prion disease was so rapid, shouldn’t any prodromal period be very rapid and brief too? But there were no data on which to base the argument back then. We had only just launched our clinical study of people at risk for genetic prion disease at Mass General (it’s still enrolling, by the way), and the London study had been ongoing for years but with no data published yet.
Today, we finally have some data. Here is the plot we put in our commentary:
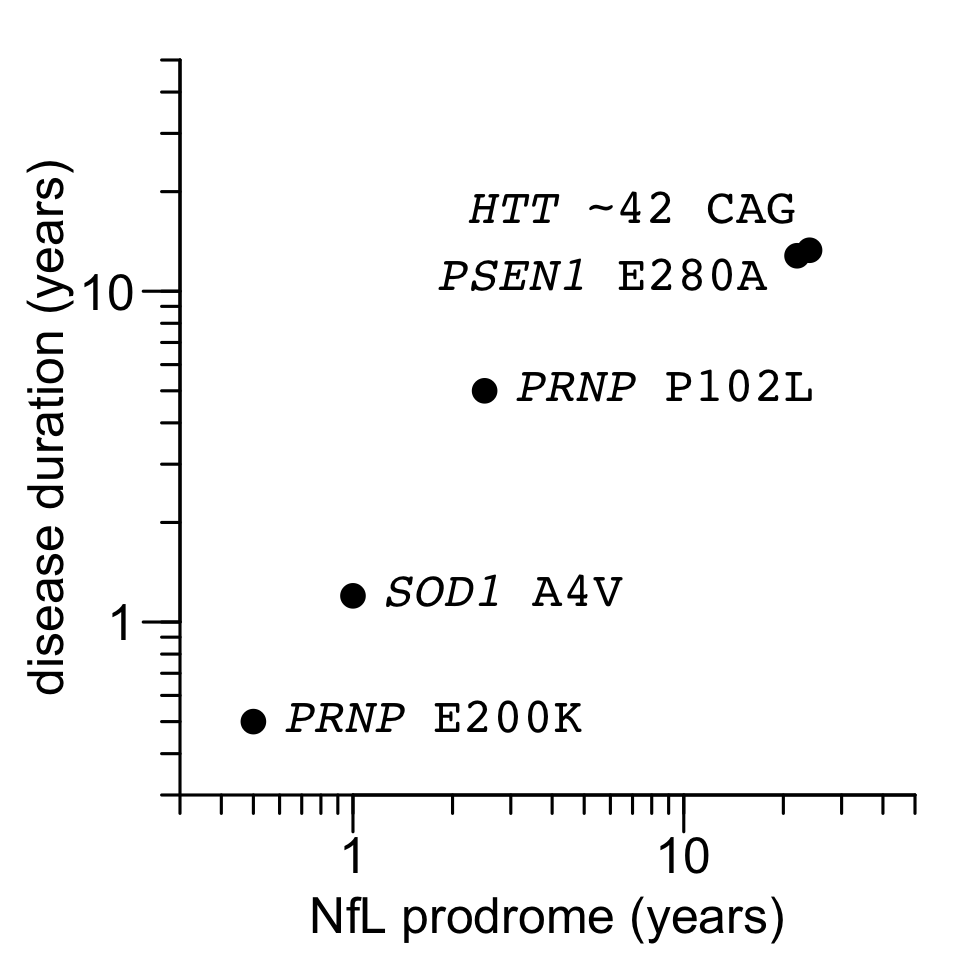
Figure 1 from Minikel & Vallabh 2023. Source code and data for this plot.
The sources of data are as follows:
| gene / mutation | NfL prodrome (years) | reference | survival (years) | reference |
|---|---|---|---|---|
| PSEN1 E280A | 22 | Quiroz 2020 | 12.8 | Ryman 2014 |
| HTT ~42 CAG | 24 | Scahill & Zeun 2020 | 13.3 | Langbehn 2022 |
| SOD1 A4V | 1 | Benatar 2018 | 1.2 | Bali 2017 |
| PRNP P102L | 2.5 | Mok 2023 | 5 | Minikel 2019 |
| PRNP E200K | <0.5 | Mok 2023 | 0.5 | Minikel 2019 |
Overall, my view is that, with just a handful of examples but a very wide spread in rapidity of disease, this elegantly confirms something that has always seemed pretty intuitive.
At the same time, perhaps much more interesting than what this plot shows are the complications and considerations that it doesn’t show. Read on.
first prions, then damage
How long neuronal damage has been going on isn’t, and shouldn’t be, the full story. After all, NfL doesn’t cause any of these diseases. NfL is just a bystander. Whether it’s misfolded PrP or somatically expanded huntingtin, there’s one causal protein in each disease that has to first go wrong in some critical way. Can’t we detect the problem with that causal protein sooner?
In prion disease, many long thought that prion replication and neurotoxicity were separate and non-overlapping phases, that prions had to replicate to their maximal titer before any neuronal damage would ensue. That now appears not quite true. When we measured plasma NfL in prion-infected mice it was elevated by 60 days post-inoculation, while prion titer is very much still rising [Minikel 2020]. Still, the original “two-phase” model isn’t completely false. Even if prions don’t need to reach their maximal level to hurt neurons, they do seem to need to build up to a certain level, and that takes time. 2 months in a mouse. How long in a human? Mok reported 2 people with the E200K mutation who were still alive and asymptomatic 3 years (and counting) after having prion seeds detected in their spinal fluid.
And that’s for PRNP’s most rapid mutation. If prions multiply for at least 3 years leading up to a disease that lasts 6 months, then what about diseases that last 5, 10, or 20 years? Oddly, we don’t know. You’d think prion replication should go on yet longer in P102L, which causes a ~5-year disease course, but we currently have no idea, because RT-QuIC just doesn’t work very well for P102L. Mok made some progress on developing a custom assay using sequence-matched P102L recombinant PrP, but it’s still less than 50% sensitive even in symptomatic patients, and they got a positive result in only one at-risk patient, with prognostic value yet to be determined.
For the other diseases considered here, it’s not clear we know much more. In early onset Alzheimer’s, one can measure Aβ deposition in the brain using PET scans, but surprisingly, this doesn’t seem to be sensitive any earlier than NfL is — the estimate I’ve seen is 15 years [Bateman 2012]. In HD we can measure mutant huntingtin (mHTT) in CSF, and again, it doesn’t seem to rise sooner than NfL [Byrne 2018]. Are these diseases fundamentally different in the way causal proteins hurt neurons? Or is it just a matter of assay sensitivity?
One possibility is that in prion disease we benefit from the fact that RT-QuIC, used to detect prions in CSF, amplifies exponentially, whereas for Aβ PET, there is no amplification step, you just see what is there. This seems like a logical argument. And yet, contradicting this line of thinking is the fact that CSF doesn’t actually contain billions of prion seeds the way brain parenchyma does. Serial dilution of CSF samples from prion disease patients has shown that you hit endpoint pretty quickly [Orru 2015a]; symptomatic patients only have about 1 to 5 seeds per microliter. Moreover, when Mok performed endpoint titration on CSF from RT-QuIC positive E200K individuals, the concentration of seeds was similar whether after onset or at the timepoint ≥3 years from onset. That’s based on just an N of 2 individuals, 4 samples, but still, it makes it harder to argue that RT-QuIC’s heroic sensitivity is the reason it precedes NfL by so much, in contrast to other diseases.
An alternative argument is that maybe RT-QuIC looks directly at the root cause of disease — PrP misfolding — in a way that disease-specific biomarkers in other neurodegenerative diseases fail to. Maybe if we had a way to look directly at somatic HTT CAG repeat length in medium spiny neurons, we’d see it moving a decade or two before NfL does. Instead, when we look at mHTT in CSF, we’re really just seeing whether mHTT, which is cytosolic, has been released from cells, which is to some degree just revealing neuronal damage not so different from what NfL indicates. I’m no Alzheimer’s expert, but from what I hear, some subset of people who study Alzheimer’s would argue that Aβ plaques per se, which we’re imaging with florbetapir, are not actually the causal species in AD either, but rather just a sequela.
years to what exactly?
Here’s another problem: how do we define the duration of an NfL prodrome? Does it start when:
- An individual’s NfL rises above a certain threshold
- An individual’s rate of change in NfL rises above a certain threshold
- A group’s rate of change in NfL is statistically different from another group
NfL is non-normally distributed, rises with age even in healthy individuals, and exhibits considerable variability both between and within individuals. So trying to set one hard cutoff and say NfL needs to rise above X to be prodromal, is not going to be a very sensitive strategy. Comparing each person to individual baselines, in essence looking at the first derivative of NfL, is more sensitive. But even then, some individual changes in NfL might just be measurement error, factors besides one’s disease onset, other things we don’t fully understand yet. So in the end, many studies look at groups’ rates of change. This is essentially what Mok is doing when regressing NfL against years to onset, which gives the ~2.5 year prodrome estimate for P102L.
And does an NfL prodrome end when:
- The individual is observed to become symptomatic
- The individual is expected to become symptomatic
Ideally you’d base your analysis on when each person gets sick, and that’s exactly what Mok did. (In the pre-print there was more discussion of expected onset, which I objected to in my last post on the topic; this aspect was downplayed in the final published version). But when I looked for comparators from other diseases, I found that the number of individuals followed to actual onset is very small; most studies of this issue are based on expected onset. Indeed, for the very long prodromes in AD and HD, scientists literally haven’t been collecting samples for long enough to allow them to speak in terms of actual onset. The Dominantly Inherited Alzheimer’s Network (DIAN), which brought us the NfL findings in AD, was established only in 2008, so for a publication in 2020 to have established a 22-year NfL prodrome relative to actual onset [Quiroz 2020] is an impossibility.
Therein lies a problem. Age of onset for most of these neurodegenerative diseases is rather variable, and not well predicted at the moment. There is clearly some heritable element, but I am skeptical of claims that one can accurately predict an individual’s onset based on family history, because ascertainment bias alone is sufficient to create a strong observed correlation between parent and child age of onset [Minikel 2014]. For PSEN1 E280A, age of onset was estimated at (mean±sd) 38.4 ± 8.6 [Ryman 2014, Supplemental Table 1]. Let’s say it’s reasonably close to normally distributed. For the sake of example, imagine you enroll 1,000 PSEN1 E280A carriers at age 20, measure their NfL, and compare it to 1,000 non-carriers. The median carrier in your study is 18 years from onset, but 160 of your participants have less than 10 years to onset, and 25 of them are going to have onset next year. Imagine if the truth is that NfL exhibits no movement until 1 year before onset, and then triples in that 1 year. In that case, the distributions of NfL (and dNfL/dt) in your controls and carriers in your study are different. It’s just a matter of power. If you enroll enough people in your study, you will see a statistically significant difference in NfL or dNfL/dt in a population 18 years from “expected” onset, even if the change occurs only 1 year from actual onset. And if the change occurs 10 years before actual onset, you probably don’t even need all that much power to convince yourself that you see it 18 years before “expected” onset.
Quantitatively, then, I am not sure how much one can hang one’s hat on the long prodrome estimates for AD and HD, which are both necessarily based on “expected” onset. I doubt the estimates will be wrong by an order of magnitude, which is why I’m still comfortable with including them in the above plot — but figuring out how certain we are about these estimates by following people to actual onset will take, of course, decades. Almost tautologically, in the above plot, it is only the data points for the short prodomes that are based on actual onset, because those prodromes are the ones short enough to see in the time since researchers started looking. In SOD1 A4V ALS, the estimate of a 1 year prodrome is based on N=10 people who became symptomatic on study [Benatar 2018]. Which leads one to note a converse problem: following anyone to actual onset is slow/hard/unlikely, so the N is small for these short prodromes. Now take the whole argument from the previous paragraph and invert it: maybe NfL exhibits subtle movement in SOD1 ALS 2 years before actual onset, but NfL is variable enough that you have no power to see it in just 10 people. But again, I doubt we’re wrong by an order of magnitude. Look at the plot in Figure 3A from [Benatar 2018], showing the serum NfL trajectories of SOD1 carriers who converted. Forget power, forget statistics, just look at the magnitude of change. 8/10 the readings from <1 year to onset are above the highest value seen in controls, while 4/4 samples between 1-2 years before onset are in the control range. Yes, maybe with more power we’d tease out a subtle signal 2 years in advance, but the magnitude of the change would have to be small. Which in turn means that for any individual, given both natural biological variability and measurement error, neurologists are pretty unlikely to be able to make clinical use of any changes so early on.
Overall, a moderate level of discomfort is called for when making inferences about prodromes based on either a hard endpoint (actual onset) but small N, or a sketchy endpoint (expected onset) but large N. We have to do the best we can do, but it’s not perfect. This discomfort may be the reason it was hard to find more than 5 data points to put on that plot. Take for example C9orf72, which I thought for sure we should be able to include in that plot. I found several studies that looked at NfL in pre-symptomatic C9orf72 carriers [Poesen 2017, Meeter 2018, Benatar 2019, van der Ende 2019, Saracino 2021, Wilke 2022]. But reading these papers I didn’t see a clear consensus as to how early NfL starts rising; many authors did not venture a guess. The answer could also differ for patients with a more ALS-like versus a more FTD-like presentation, which apparently are associated with rather different disease durations, about 3 versus 9 years respectively [Glasmacher 2020]. Maybe someone who studies C9orf72 will tell me that we do know the answer, but as an outsider reading the literature, it wasn’t obvious.
other mutations
It’s not just other diseases that are missing from that plot, it’s other PRNP mutations too. Mok had data from 3 people with octapeptide repeat insertions (OPRI), and there was no obvious NfL increase before onset. In D178N, even at the symptopmatic stage, NfL is not nearly as elevated as it is in sporadic CJD or E200K, and NfL showed no prodromal increase in one pre-symptomatic D178N individual who was followed to onset [Hermann 2022].
Thus the perennial question in data science: does a missing value mean zero, or unknown? Have we not detected prodromes in OPRI and D178N because there are none to detect, or because we lack power? In terms of disease duration, D178N is slightly slower than E200K, and OPRI is a lot slower, so if you believe the overall conclusion of the above plot, there should be changes happening well in advance of symptoms. Maybe NfL just has little dynamic range in these forms of prion disease, and standard RT-QuIC, for whatever conformational reason, can’t detect the prions associated with these subtypes. A grand challenge for the prion field will be to find a prodromal marker for these subtypes. Even more ideally, one prodromal marker useful across all subtypes.
final reflections
I’ve said before, we should aspire to prevent prion disease before anything goes wrong in the brain, not wait for prodromal change. But there’s no doubt that being able to detect prodromes would be a really valuable asset. If there’s one final takeaway from this post, it’s just how much work remains to be done.

About Eric Vallabh Minikel
Eric Vallabh Minikel is on a lifelong quest to prevent prion disease. He is a scientist based at the Broad Institute of MIT and Harvard.